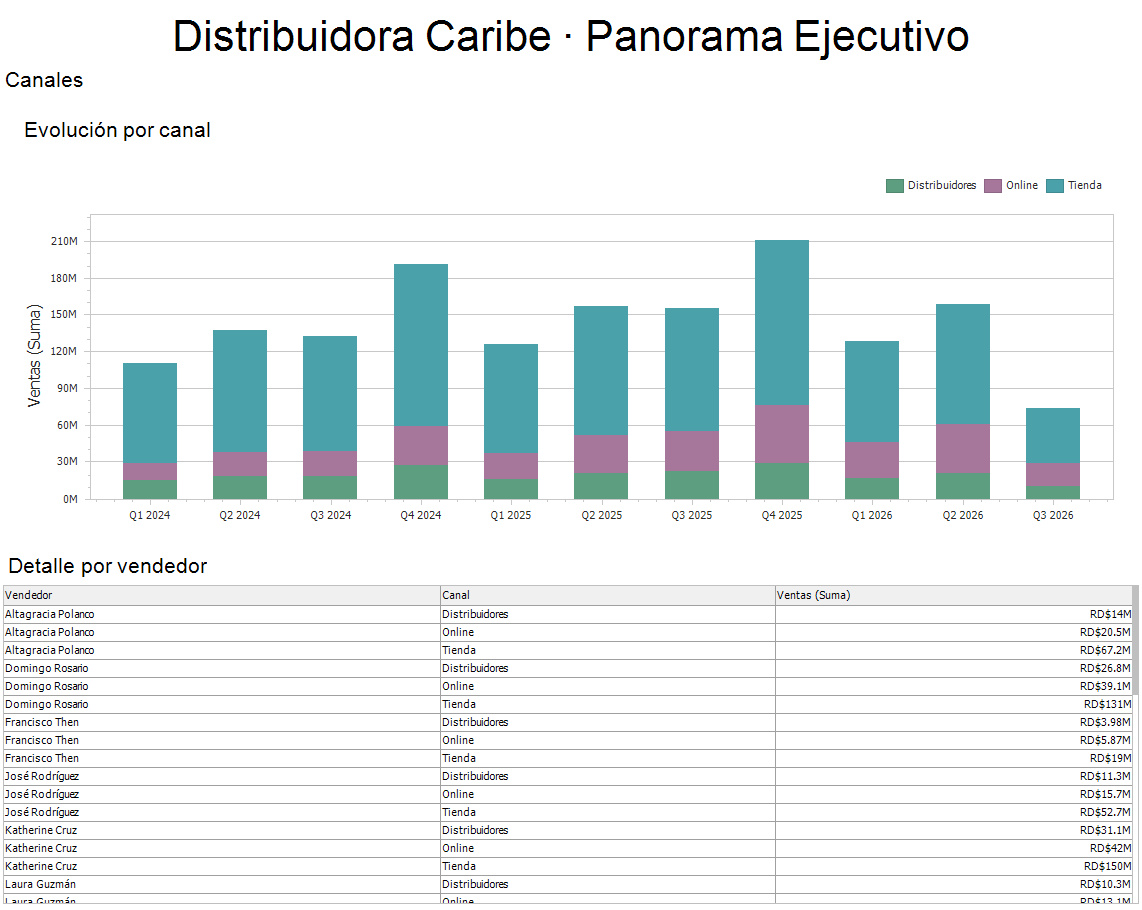
business intelligence · your AI agent for your data

Bring your Claude subscription and turn it into your data agent.

i360 is the app with Claude Code living inside: an agent with 143 tools that analyzes your data, explains where a change came from, spots what broke from the norm and delivers it as a dashboard, PowerPoint or Excel — then looks at its own work and fixes it.

No Claude subscription? No problem: the PeopleWorks plan brings the intelligence.

Claude thinks. i360 builds.

143
tools
6
data sources
2
ways to pay
140
shared with Copilot

private by design

Claude directs. i360 does the work on your PC.

We don't hand your database to the AI: the agent works on your PC. Claude understands your question, decides which tools to use and in what order, and coordinates their execution. Queries, calculations, the dashboard, the Excel workbook and the PowerPoint deck are built by i360 on your machine, against your database.

  1. You ask“How are we doing against target by branch?”
  2. Claude plansIt picks the tools and the order: query, calculate, build, review.
  3. i360 runs it on your PCIt queries your database read-only, calculates with your database and the DevExpress engine, and builds the dashboard.
  4. You get the resultA live dashboard, with your numbers calculated by your database, not by the model.

What stays with you

  • Your database and your complete files.
  • Your credentials: encrypted on your PC; they never go through the chat.
  • The calculations: done by your database and the DevExpress engine, on your machine.
  • Your dashboards, your Excel workbooks and your decks.

The only things Claude receives

  • Your question.
  • The structure of your data (tables and columns), when needed.
  • Totals and aggregates to answer. With Private Mode (on by default) not a single row of your data reaches it: previews, samples and filters are shown only to you, inside i360.
  • A screenshot of the dashboard it builds, so it can check its own work — only if you turn Private Mode off.

With your own subscription, that conversation goes straight from your PC to Claude: PeopleWorks never sees it. Private Mode is on by default; if you want Claude to see samples and the screenshot to fine-tune the design, turn it off with one click (and back on whenever you like).

Your data, wherever it lives

i360 connects to the database you already have — or to the XML cube your ERP produces — and the assistant learns its structure on its own: roles, aggregations, even your business rules.

SQL Server MySQL/MariaDB PostgreSQL SQLite OleDb / Access ERP XML direct SQL queries

your data, with meaning

We help document your data and build its dictionary.

Describe what each column means, how to interpret it and how it should be calculated. i360 helps you prepare a data dictionary —descriptions, roles, aggregations and formats— so the AI can better understand the information and work with your business context.

How to explain a data field

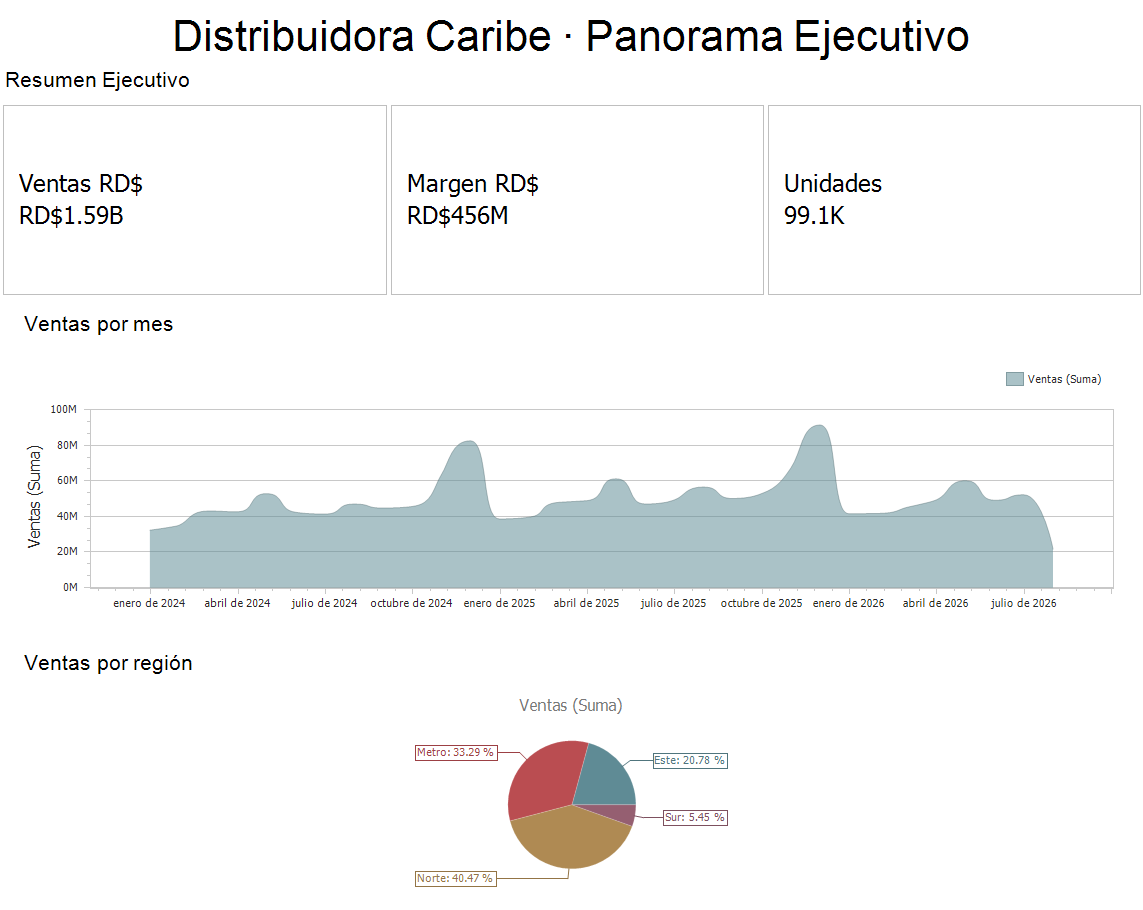
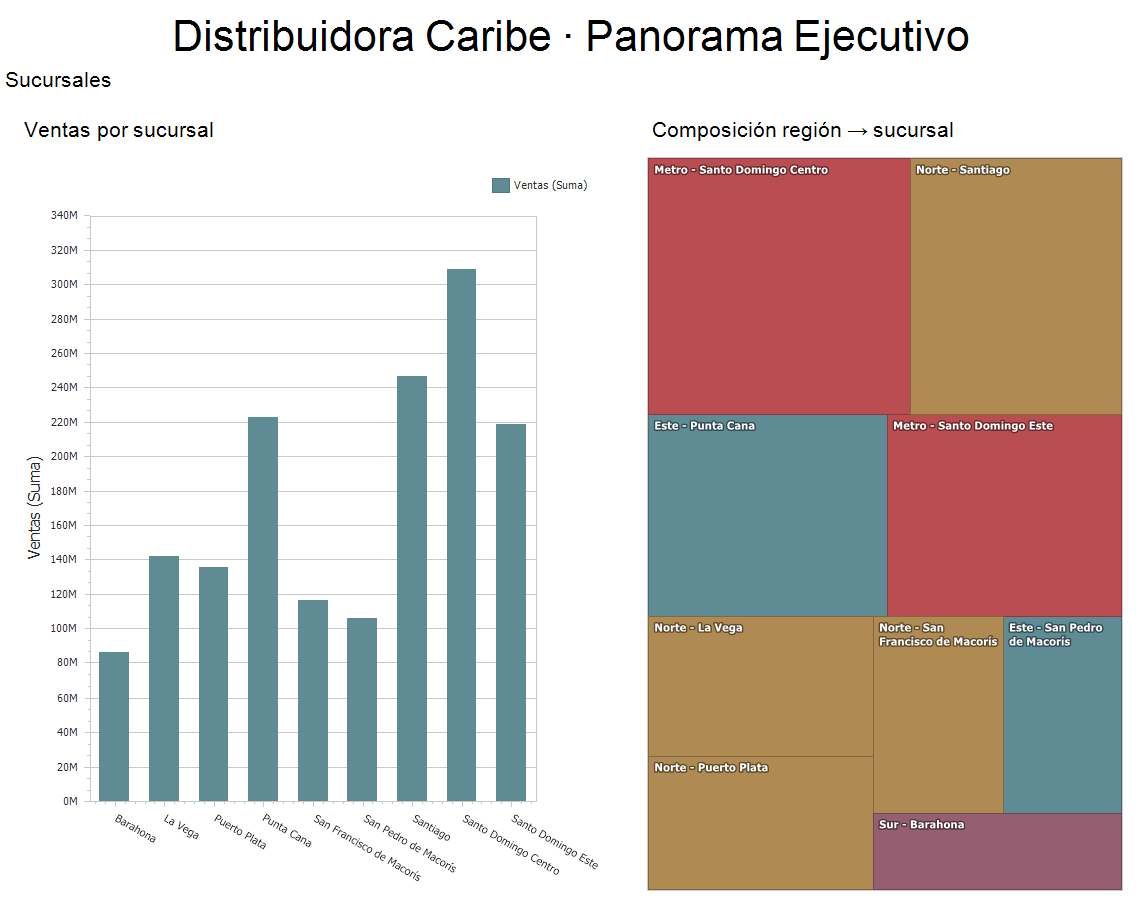
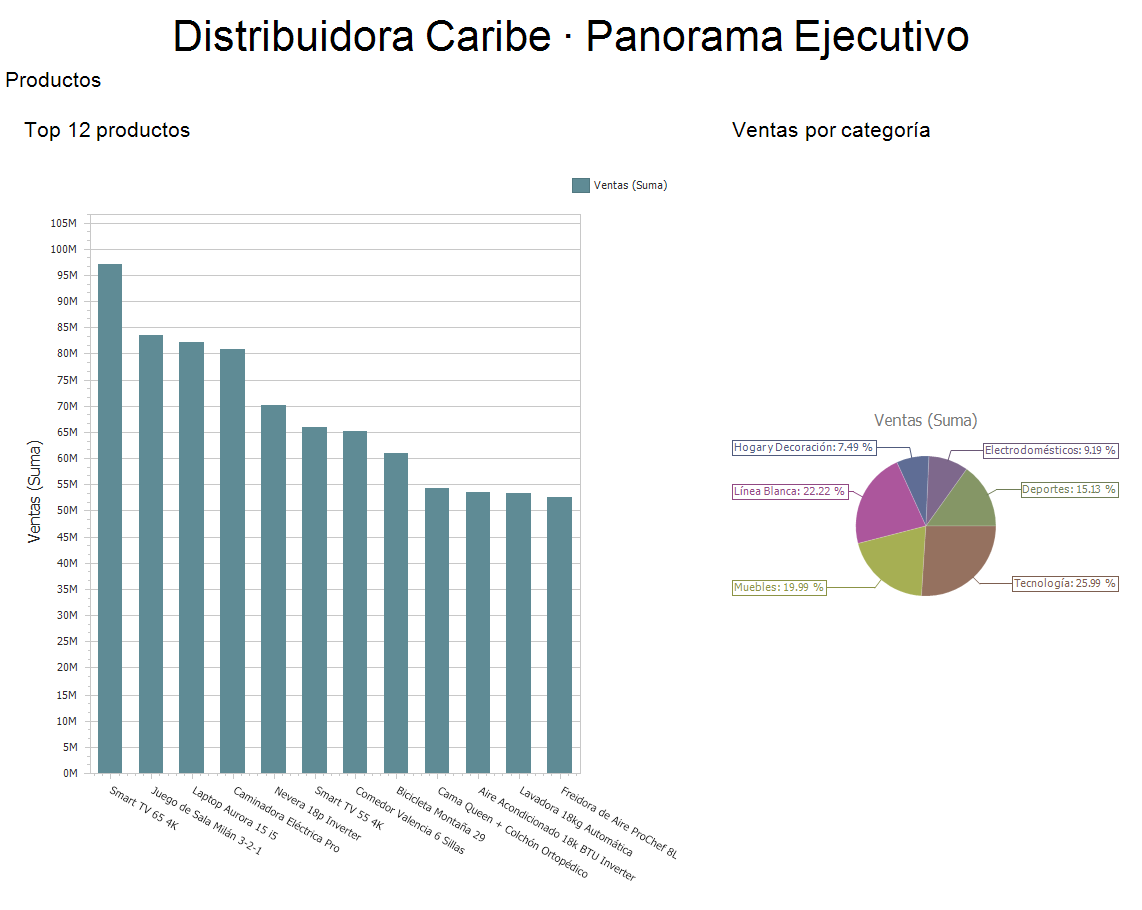
Example using the Distribuidora Caribe demo columns. The dictionary preserves the original column names.

ColumnMeaningHow to use it
VentasSale amount after the discount.Measure · sum · RD$ format
SucursalBranch where the sale takes place.Dimension for grouping and comparison
FechaDate of the sale.Time axis for trends

Context you can review and reuse

Schema analysis suggests roles, aggregations and visualizations. You complete or correct the descriptions and teach business rules; the assistant uses this context when querying and building.

Schema profiles let you save and distribute that dictionary for XML files with the same column structure. You can also generate dashboard documentation to explain its sources, metrics and filters.

The person validates the meaning. A clear description helps prevent the AI from confusing a measure, date or category.

Three steps and you're building

No API keys to paste, no folder setup, no permission prompts. i360 prepares the whole Claude environment by itself.

STEP 01

Bring your Claude

Install Claude Code with your subscription — the one you already use every day. Don't have one? The PeopleWorks plan brings the intelligence and you just paste a token.

STEP 02

Open i360 and hit “Claude”

The ribbon button (Ctrl+Shift+K) opens the Dashboard Expert panel, already connected to your data and to the editor's 143 tools.

STEP 03

Ask for your dashboard

“Build me an executive sales dashboard.” It analyzes, builds, reviews its own work and tells you when it's ready to save. You always have the final word.

under the hood, no smoke

Zero-config for real:
i360 writes this for you.

When you hit “Claude”, the editor prepares everything itself: the tool bridge, the Expert's profile and — on the PeopleWorks plan — the platform connection. You never touch a file. This is the only one you could touch, and it's this short:

asistente.json %LOCALAPPDATA% / i360DashBoardEditor
{  "Backend": "subscription"  // your everyday Claude}
{  "Backend": "relay",  // platform-billed  "RelayUrl": "https://relay.peopleworksservices.com"}

With your own subscription you don't even need this file: i360 detects your claude, prepares the workspace, pre-authorizes its 143 tools and denies the dangerous ones. You open it and ask.

On the PeopleWorks plan, the platform URL in the file and your token configured in i360. The intelligence travels through our gateway — with context caching so every question costs less — and your database and files stay on your machine.


like Excel formulas

Excel has formulas. i360 has tools.

In Excel you type =SUM(B2:B90) and you have to know which formula to use. Not here: you ask “where did this rise come from?” and the agent picks from its 143 tools: the ones that read your data, calculate, build the dashboard and assemble the Excel workbook and the PowerPoint deck. 140 are shared with PeopleWorks Copilot and 3 are exclusive to MCP.

Available today

Datasource Studio

SQL Server, PostgreSQL, MySQL/MariaDB and SQLite. Choose a saved connection, test access, and explore tables, columns and relations before writing SQL.

My connections · Connect a database · Test the connection · Explore the tables · How the tables relate

The person enters the password in a secure window; it is stored encrypted with DPAPI. It never passes through chat. The dashboard stores only the connection NAME.

Database read-only

SQL Studio

Write and validate SQL with the engine without executing it. Review a preview together and inspect the estimated plan for optimization. Then profile 2,000 real rows and build the dashboard in one step, first saving a restorable version.

Write a query · Preview · Optimize a query · Query to dashboard

A read-only guard in the program and a read-only or rolled-back transaction. The database is only read; saving a query or a design does not modify its records.

Full edition

Analysis board

A canvas where every question to your data is a node with its real answer: branch, drill down, cross two measures and write down the conclusion. Claude investigates in plain sight with its tools, and whatever is worth keeping goes to the dashboard with its filters. A pinboard keeps your ideas and Claude's notes for the next visit.

Open the analysis board · Ask the data · Cross two measures · Write down a conclusion · Interactive card · Forecast · Pin it · Send to the dashboard · Watch for you · Watch now

Data privacy: Claude works with totals, shares and trends, never with rows; the board and its pinboard are saved on your PC.

“Sales by branch from my SQL database”

143 Claude · 140 Copilot
Understand your data30Read the dashboard · get_dashboard_contextColumns and roles · list_columnsSuggest a chart · suggest_visualizationBoard summary · get_data_summaryVisible metrics · get_visible_metricsExplain the hints · get_hints_infoThe Copilot catalog · list_available_toolsRefresh the data · refresh_data_sourceRead an item · get_item_configurationCompare two items · compare_itemsUnderstand your data · auto_enhance_schemaWhat to build · get_enhanced_suggestionsSave the XML profile · create_schema_profileSaved profiles · list_schema_profilesExport the profiles · export_profiles_bundleReal samples · get_data_sampleStatistics per column · get_summary_statsOutliers · find_outliersTop and bottom · find_top_nFilter by range · filter_by_rangeSearch by value · filter_by_valueWhat misses a threshold · check_complianceTotals by group · calculate_totalAverages and spread · calculate_averageTrend over time · calculate_trendsData explorer · open_data_explorerDataset tour · get_dataset_profileThe eyes: look at the dashboard · get_dashboard_screenshotWhat you missed · alerts_listMark alerts as seen · alerts_seenBuild & design37Add an item · add_dashboard_itemSet up a chart · configure_chartRemove an item · remove_itemItem title · set_item_titleBoard title · set_dashboard_titleAdd a series · add_series_to_chartSet up a KPI · configure_cardClick to filter everything · enable_master_filterChange the chart type · set_chart_typeSet up a pie · configure_pie_chartMove an item · set_item_positionResize an item · set_item_sizeGroup a chart · add_argument_to_chartDetail columns · configure_grid_columnsAdd a filter · add_filter_itemDuplicate an item · clone_itemChange the palette · set_chart_paletteSet up a gauge · configure_gaugeShow or hide · set_item_visibilityAdd a note · add_textboxCalculated field · add_calculated_fieldAdd an image · add_imagePeriod selector · configure_range_filterConditional formatting · set_conditional_formattingTop N only · configure_topnOrganize in tabs · configure_tab_containerArrange in a grid · arrange_items_in_gridDrill down · add_drill_downSave as a template · save_dashboard_templateLoad a template · load_dashboard_templateMy templates · list_available_templatesApply a theme · apply_themeSuggest a layout · suggest_optimal_layoutStep-by-step wizard · dashboard_wizardBuild the whole dashboard · generate_dashboardBuilt-in templates · list_dashboard_templatesApply a template · apply_dashboard_templateVersions & XML8The XML guide · get_dashboard_xml_guideRead the XML · get_dashboard_xmlApply an XML design · apply_dashboard_xmlUndo the XML change · undo_dashboard_xmlSave a version · save_dashboard_versionDashboard versions · list_dashboard_versionsGo back to a version · restore_dashboard_versionWhat changed between versions · compare_dashboard_versionsBusiness memory11Remember a rule · add_knowledgeSaved rules · list_knowledgeFind a rule · search_knowledgeForget a rule · delete_knowledgeExample rules · seed_knowledge_examplesExport the rules · export_knowledgeSearch DevExpress docs · search_devexpress_docsAdd a document · rag_add_documentThe library · rag_list_documentsSearch your documents · rag_searchRemove a document · rag_remove_documentExcel & PowerPoint7Export to Excel · export_dashboardExport as an image · export_item_to_imageDocument the dashboard · generate_documentationBuild a PowerPoint deck · generate_powerpointBuild an Excel workbook · generate_excelExport the full data · export_dashboard_dataShow the presentation · show_presentationCheck & speed up5Validate the board · validate_dashboardMeasure complexity · analyze_dashboard_performanceWhy it is slow · diagnose_dashboard_performanceStart timing · start_performance_traceSee the timings · stop_performance_traceDatasource Studio6My connections · list_connectionsConnect a database · connect_datasourceTest the connection · test_connectionExplore the tables · explore_schemaHow the tables relate · map_relationsSample database · create_sample_databaseSQL Studio5Query to dashboard (shortcut) · generate_dashboard_from_queryWrite a query · write_queryPreview · preview_queryOptimize a query · optimize_queryQuery to dashboard · dashboard_from_queryAnalysis board34Open the analysis board · open_analysis_boardRead the board · board_readAsk the data · board_askCross two measures · board_combineWrite down a conclusion · board_noteSend to the dashboard · board_promoteShow a node · board_focusRemove a node · board_removeNode chart · board_chartHow it is summarized · board_aggregationSave the board · board_saveBoard versions · board_historyRestore a saved board · board_restoreInteractive card · board_cardAgainst the target · board_targetChange bridge · board_bridgeOdd ones out · board_oddAgainst last year · board_yoyForecast · board_forecastThe analysis deck · board_exportPin it · board_pinRead the pinboard · board_pinsMark done · board_unpinWatch for you · watch_createWhat the iWorker watches · watch_listPause a watch · watch_setWhat the iWorker saw · watch_logWatch now · watch_runHow the alerts email stands · mail_statusAdjust the alerts email · mail_setTest the email · mail_testAlerts by email · mail_openWho's watching now · watch_statusWatch with i360 closed · watch_autostart i360 + Claude analyze · explain · deliver
Explore the tools

The trace has finished. Select a dot to see what it does and what to ask your Claude.

0:32 / 0:32
Read the script · accessible transcript
  1. Request: “Sales by branch from my SQL database.”
  2. My connectionslist_connectionsChooses a saved connection. The password never enters chat.
  3. Explore the tablesexplore_schemaReads tables, columns and samples to understand the data.
  4. How the tables relatemap_relationsChecks how sales and branches join; confirms inferred relations.
  5. Write a querywrite_queryWrites and validates the SELECT with the engine without executing it.
  6. Previewpreview_queryShows real rows with limits and a read-only or rolled-back transaction.
  7. Query to dashboarddashboard_from_queryAnalyzes 2,000 real rows and builds the board after saving a restorable version.
  8. The eyes: look at the dashboardget_dashboard_screenshotThe eyes: inspects the result and notices an unclear title.
  9. Item titleset_item_titleCorrects the title to “Sales by branch”.
  10. Save a versionsave_dashboard_versionSaves a design version in the history.
  11. Now explore: every dot is a real tool.

The complete catalog · 143 tools

READ retrieves information. WRITE changes the editor, configuration or a file; it never means permission to write to the SQL database. MCP-only tools are marked.

Type a tool name while the selector is focused to find it. Selecting filters the list even without JavaScript. Open any row to read its card.

143 tools available

Understand your data · 30

Averages and spreadcalculate_averageREAD
READ

Computes averages, median, deviation, percentiles and distribution, optionally grouped.

Ask your Claude:«Calculate average order value by branch.»

Shared catalog · Copilot and Claude

Board summaryget_data_summaryREAD
READ

Summarizes item counts, visualization types and active master filters.

Ask your Claude:«Summarize this board's structure.»

Shared catalog · Copilot and Claude

Columns and roleslist_columnsREAD
READ

Lists available columns, descriptions, types, roles and aggregations.

Ask your Claude:«Show me the columns and their roles.»

Shared catalog · Copilot and Claude

Compare two itemscompare_itemsREAD
READ

Compares two items' bindings, visual settings, layout and interaction.

Ask your Claude:«Compare these two charts.»

Shared catalog · Copilot and Claude

Data exploreropen_data_explorerWRITE
WRITE

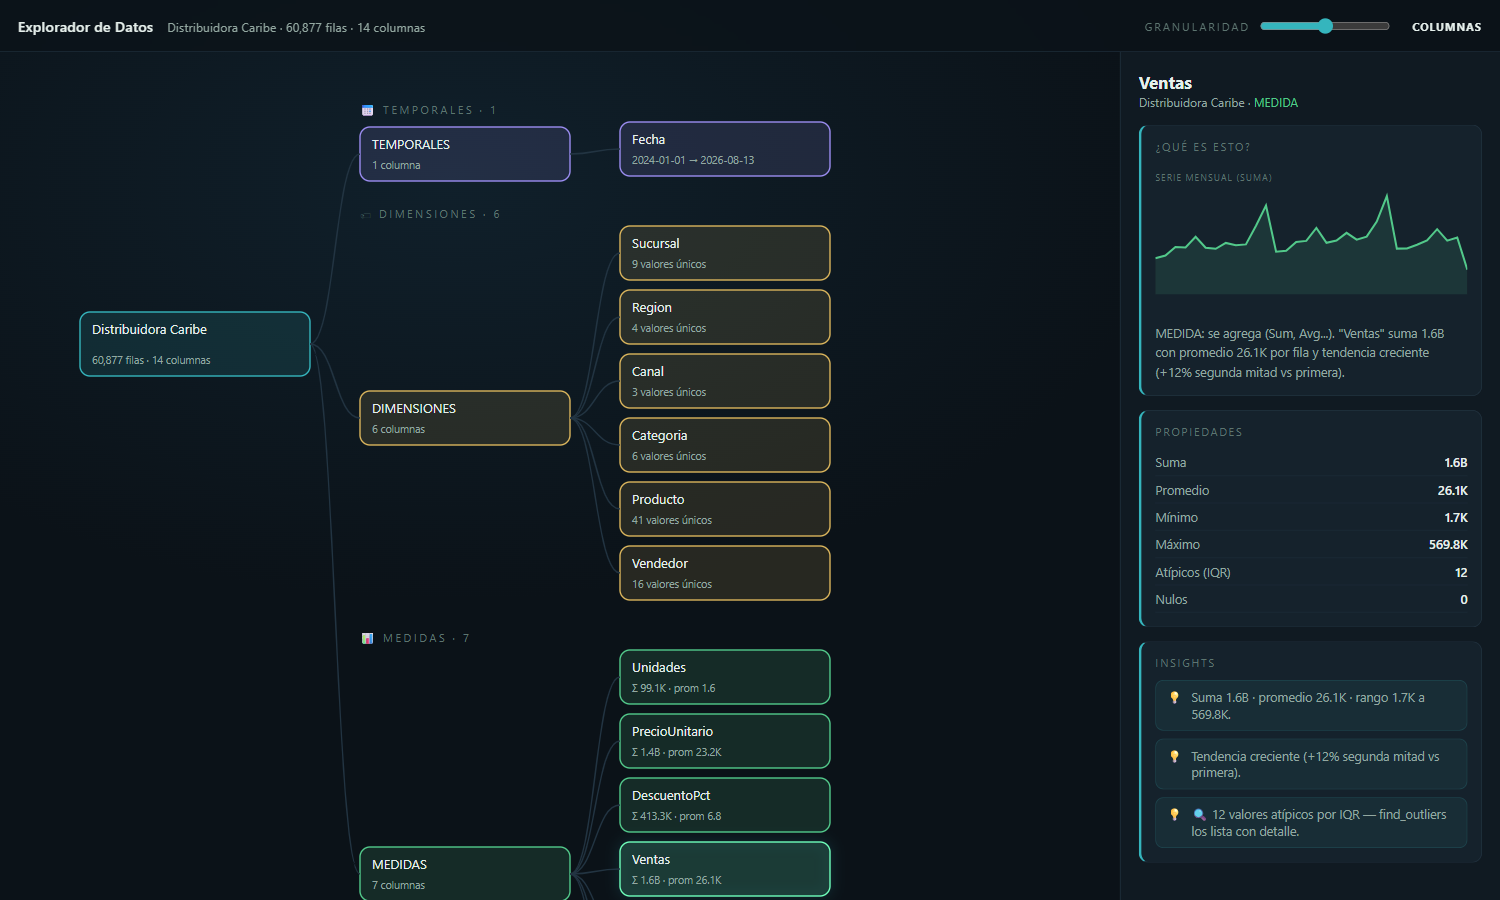
Opens a navigable data graph with roles, granularity, statistics, charts and automatic insights.

Ask your Claude:«Open the explorer for this data.»

Shared catalog · Copilot and Claude

Dataset tourget_dataset_profileREAD
READ

Reads the full dataset profile: roles, distributions, monthly series, nulls, concentration and outlier insights.

Ask your Claude:«Give me a tour of the dataset.»

Shared catalog · Copilot and Claude

Explain the hintsget_hints_infoREAD
READ

Explains the available database hints and how to configure them.

Ask your Claude:«Explain my data hints.»

Shared catalog · Copilot and Claude

Export the profilesexport_profiles_bundleWRITE
WRITE

Exports schema profiles as a JSON bundle for other installations.

Ask your Claude:«Export the profiles for my customers.»

Shared catalog · Copilot and Claude

Filter by rangefilter_by_rangeREAD
READ

Returns records in a numeric or date range and subset statistics.

Ask your Claude:«Show me last quarter's sales.»

Shared catalog · Copilot and Claude

Mark alerts as seenalerts_seenWRITE
WRITE

Marks an alert (or all of them) as seen, only when the person says so: the bell goes down and the iWorker card on the pinboard stops saying “something new”.

Ask your Claude:«I've seen them: mark them as seen.»

Shared catalog · Copilot and Claude

Outliersfind_outliersREAD
READ

Detects outliers with the IQR method and returns the affected rows.

Ask your Claude:«Find unusual sales.»

Shared catalog · Copilot and Claude

Read an itemget_item_configurationREAD
READ

Reads an individual item's detailed configuration.

Ask your Claude:«How is this KPI configured?»

Shared catalog · Copilot and Claude

Read the dashboardget_dashboard_contextREAD
READ

Reads the current dashboard structure, items, data sources and available database hints.

Ask your Claude:«What is in this dashboard?»

Shared catalog · Copilot and Claude

Real samplesget_data_sampleREAD
READ

Reads real sample rows, extremes and per-column statistics.

Ask your Claude:«Show me real samples from this data.»

Shared catalog · Copilot and Claude

Refresh the datarefresh_data_sourceWRITE
WRITE

Reloads the dashboard's data sources into the editor; does not modify the database.

Ask your Claude:«Refresh the board's data.»

Shared catalog · Copilot and Claude

Save the XML profilecreate_schema_profileWRITE
WRITE

Creates a reusable schema profile matched by column fingerprint for similarly structured XML datasets.

Ask your Claude:«Create a reusable profile for this XML.»

Shared catalog · Copilot and Claude

Saved profileslist_schema_profilesREAD
READ

Lists schema profiles with fingerprints, columns, usage and dates.

Ask your Claude:«Show me the schema profiles.»

Shared catalog · Copilot and Claude

Search by valuefilter_by_valueREAD
READ

Searches text values with partial, case-insensitive matching and summarizes the subset.

Ask your Claude:«Find records for the North branch.»

Shared catalog · Copilot and Claude

Statistics per columnget_summary_statsREAD
READ

Computes minima, maxima, means, sums, distinct values, nulls and text frequencies.

Ask your Claude:«Summarize statistics for every column.»

Shared catalog · Copilot and Claude

Suggest a chartsuggest_visualizationREAD
READ

Recommends a visualization for a column using its semantic hints.

Ask your Claude:«Which chart suits Sales?»

Shared catalog · Copilot and Claude

The Copilot cataloglist_available_toolsREAD
READ

Lists the shared Copilot tool catalog and usage examples.

Ask your Claude:«Which tools does Copilot have?»

Shared catalog · Copilot and Claude

The eyes: look at the dashboardget_dashboard_screenshotREAD
READ

Captures the dashboard as the person sees it so Claude can inspect its work. MCP only.

Ask your Claude:«Look at the dashboard and check titles and contrast.»

Claude exclusive · MCP

Top and bottomfind_top_nREAD
READ

Finds highest or lowest N records with subset statistics and share of total.

Ask your Claude:«Who are the top customers?»

Shared catalog · Copilot and Claude

Totals by groupcalculate_totalREAD
READ

Calculates a column sum, optionally grouped, with each group's share.

Ask your Claude:«Calculate sales by region.»

Shared catalog · Copilot and Claude

Trend over timecalculate_trendsREAD
READ

Analyzes time trends, changes and periods of growth or decline.

Ask your Claude:«How do sales change month by month?»

Shared catalog · Copilot and Claude

Understand your dataauto_enhance_schemaWRITE
WRITE

Analyzes data and updates semantic hints for roles, aggregations, formats and visualizations.

Ask your Claude:«Detect measures, dimensions and dates in my data.»

Shared catalog · Copilot and Claude

Visible metricsget_visible_metricsREAD
READ

Lists visible measures and their aggregation settings.

Ask your Claude:«Which metrics are visible?»

Shared catalog · Copilot and Claude

What misses a thresholdcheck_complianceREAD
READ

Finds records that violate a threshold, with counts and deviation statistics.

Ask your Claude:«Which sales fell below target?»

Shared catalog · Copilot and Claude

What to buildget_enhanced_suggestionsREAD
READ

Suggests charts, KPIs and filters using previously enhanced schema hints.

Ask your Claude:«What should we build with this data?»

Shared catalog · Copilot and Claude

What you missedalerts_listREAD
READ

The alerts center: what i360 had to tell the person even if they weren't looking —what's new from the iWorker, a rule that couldn't be judged, today's report, Claude's notes— with its dashboard, when, and how many unseen the bell shows.

Ask your Claude:«What did I miss?»

Shared catalog · Copilot and Claude

Build & design · 37

Add a filteradd_filter_itemWRITE
WRITE

Adds an interactive ComboBox or ListBox filter.

Ask your Claude:«Add a region filter.»

Shared catalog · Copilot and Claude

Add a noteadd_textboxWRITE
WRITE

Adds a text box for annotations or titles.

Ask your Claude:«Add a note about the Christmas season.»

Shared catalog · Copilot and Claude

Add a seriesadd_series_to_chartWRITE
WRITE

Adds a measure series with a specified aggregation to an existing chart.

Ask your Claude:«Add margin as the second series.»

Shared catalog · Copilot and Claude

Add an imageadd_imageWRITE
WRITE

Adds an image from a local file or URL to the dashboard.

Ask your Claude:«Add the company logo.»

Shared catalog · Copilot and Claude

Add an itemadd_dashboard_itemWRITE
WRITE

Adds a chart, card, grid, pie, gauge or pivot item.

Ask your Claude:«Add a sales card.»

Shared catalog · Copilot and Claude

Apply a templateapply_dashboard_templateWRITE
WRITE

Replaces the current dashboard items with the selected built-in template.

Ask your Claude:«Apply the Executive template to the board.»

Shared catalog · Copilot and Claude

Apply a themeapply_themeWRITE
WRITE

Applies a predefined Corporate, Modern, Classic, Dark or Light dashboard theme.

Ask your Claude:«Apply the Corporate theme.»

Shared catalog · Copilot and Claude

Arrange in a gridarrange_items_in_gridWRITE
WRITE

Arranges dashboard items automatically in an optimized grid.

Ask your Claude:«Arrange the board in a grid.»

Shared catalog · Copilot and Claude

Board titleset_dashboard_titleWRITE
WRITE

Changes the main dashboard title and its visibility.

Ask your Claude:«Title the board Executive sales.»

Shared catalog · Copilot and Claude

Build the whole dashboardgenerate_dashboardWRITE
WRITE

Analyzes the current data and creates a complete dashboard with KPIs, trends, categories, filters and detail.

Ask your Claude:«Create an executive sales dashboard.»

Shared catalog · Copilot and Claude

Built-in templateslist_dashboard_templatesREAD
READ

Lists built-in Executive, Sales, Financial, Inventory, Operational, Comparison and Trend templates.

Ask your Claude:«Which built-in templates are available?»

Shared catalog · Copilot and Claude

Calculated fieldadd_calculated_fieldWRITE
WRITE

Adds a calculated field to a dashboard data source.

Ask your Claude:«Create a percentage margin field.»

Shared catalog · Copilot and Claude

Change the chart typeset_chart_typeWRITE
WRITE

Changes an existing chart's series type, such as bar, line or area.

Ask your Claude:«Change the trend to a line chart.»

Shared catalog · Copilot and Claude

Change the paletteset_chart_paletteWRITE
WRITE

Changes the color palette. In DevExpress the palette belongs to the whole dashboard: it recolors every chart, pie and map; Ctrl+Z undoes it.

Ask your Claude:«Switch to the high-contrast palette.»

Shared catalog · Copilot and Claude

Click to filter everythingenable_master_filterWRITE
WRITE

Enables or disables an item's ability to filter other items.

Ask your Claude:«Make a branch click filter the whole board.»

Shared catalog · Copilot and Claude

Conditional formattingset_conditional_formattingWRITE
WRITE

Applies value-based conditional formatting to grids and pivots.

Ask your Claude:«Highlight sales below target.»

Shared catalog · Copilot and Claude

Detail columnsconfigure_grid_columnsWRITE
WRITE

Configures the visible columns and widths of a grid.

Ask your Claude:«Show date, branch and sales in the detail grid.»

Shared catalog · Copilot and Claude

Drill downadd_drill_downWRITE
WRITE

Configures hierarchical navigation for charts and pies.

Ask your Claude:«Allow navigation from region to branch.»

Shared catalog · Copilot and Claude

Duplicate an itemclone_itemWRITE
WRITE

Duplicates an item with all its settings.

Ask your Claude:«Duplicate this KPI for margin.»

Shared catalog · Copilot and Claude

Group a chartadd_argument_to_chartWRITE
WRITE

Adds a dimension argument to an existing chart.

Ask your Claude:«Group that chart by region.»

Shared catalog · Copilot and Claude

Item titleset_item_titleWRITE
WRITE

Changes an item's title and can show or hide it.

Ask your Claude:«Change the title to Sales by branch.»

Shared catalog · Copilot and Claude

Load a templateload_dashboard_templateWRITE
WRITE

Loads a saved template, optionally merging with the current design.

Ask your Claude:«Load my sales template.»

Shared catalog · Copilot and Claude

Move an itemset_item_positionWRITE
WRITE

Moves an item within the dashboard layout.

Ask your Claude:«Place the trend below the KPIs.»

Shared catalog · Copilot and Claude

My templateslist_available_templatesREAD
READ

Lists previously saved dashboard templates.

Ask your Claude:«Which saved templates do I have?»

Shared catalog · Copilot and Claude

Organize in tabsconfigure_tab_containerWRITE
WRITE

Creates a tab container to organize dashboard items.

Ask your Claude:«Organize the board into Summary and Detail tabs.»

Shared catalog · Copilot and Claude

Period selectorconfigure_range_filterWRITE
WRITE

Configures a numeric or time range slider filter.

Ask your Claude:«Add a sales period range selector.»

Shared catalog · Copilot and Claude

Remove an itemremove_itemWRITE
WRITE

Removes an item by name from the current design.

Ask your Claude:«Remove the duplicate chart.»

Shared catalog · Copilot and Claude

Resize an itemset_item_sizeWRITE
WRITE

Changes an item's span in the layout.

Ask your Claude:«Give the branch chart more width.»

Shared catalog · Copilot and Claude

Save as a templatesave_dashboard_templateWRITE
WRITE

Saves the current dashboard as a reusable template.

Ask your Claude:«Save this design as a sales template.»

Shared catalog · Copilot and Claude

Set up a chartconfigure_chartWRITE
WRITE

Binds measures and dimensions to a chart with appropriate aggregations.

Ask your Claude:«Configure sales by branch as bars.»

Shared catalog · Copilot and Claude

Set up a gaugeconfigure_gaugeWRITE
WRITE

Configures a gauge with a value, scale and optional target.

Ask your Claude:«Create a progress gauge for the target.»

Shared catalog · Copilot and Claude

Set up a KPIconfigure_cardWRITE
WRITE

Configures a KPI card with its value, optional target and delta.

Ask your Claude:«Configure the sales KPI with its target.»

Shared catalog · Copilot and Claude

Set up a pieconfigure_pie_chartWRITE
WRITE

Configures pie values, categories and aggregation.

Ask your Claude:«Make the sales by category pie chart.»

Shared catalog · Copilot and Claude

Show or hideset_item_visibilityWRITE
WRITE

Shows or hides an item without removing it.

Ask your Claude:«Hide the detail grid for now.»

Shared catalog · Copilot and Claude

Step-by-step wizarddashboard_wizardWRITE
WRITE

Guides dashboard creation through template, metrics, dimensions, filters, theme, preview and generation.

Ask your Claude:«Guide me through building the board.»

Shared catalog · Copilot and Claude

Suggest a layoutsuggest_optimal_layoutREAD
READ

Recommends a layout with KPIs above charts and details.

Ask your Claude:«Suggest a better arrangement for the items.»

Shared catalog · Copilot and Claude

Top N onlyconfigure_topnWRITE
WRITE

Limits an item to the highest or lowest N values.

Ask your Claude:«Show the ten best-selling products.»

Shared catalog · Copilot and Claude

Versions & XML · 8

Apply an XML designapply_dashboard_xmlWRITE
WRITE

Validates edited XML with DevExpress, preserves live data sources and stores an undo backup before applying.

Ask your Claude:«Apply this XML design and preserve my data.»

Shared catalog · Copilot and Claude

Dashboard versionslist_dashboard_versionsREAD
READ

Lists historical design versions, dates, origins, labels and summaries.

Ask your Claude:«Which dashboard versions do I have?»

Shared catalog · Copilot and Claude

Go back to a versionrestore_dashboard_versionWRITE
WRITE

Validates and restores a version in the editor, first saving the current state and reconnecting live data.

Ask your Claude:«Return to yesterday's version.»

Shared catalog · Copilot and Claude

Read the XMLget_dashboard_xmlREAD
READ

Reads the current dashboard XML with protected data sources omitted.

Ask your Claude:«Show me the design XML.»

Shared catalog · Copilot and Claude

Save a versionsave_dashboard_versionWRITE
WRITE

Saves a labeled, restorable design version in the history.

Ask your Claude:«Save a version before changing the design.»

Shared catalog · Copilot and Claude

The XML guideget_dashboard_xml_guideREAD
READ

Reads the production XML guide, common errors and safe editing procedure.

Ask your Claude:«Read the guide before editing XML.»

Shared catalog · Copilot and Claude

Undo the XML changeundo_dashboard_xmlWRITE
WRITE

Restores the design before the last XML edit; repeating the call redoes it.

Ask your Claude:«Undo the last XML edit.»

Shared catalog · Copilot and Claude

What changed between versionscompare_dashboard_versionsREAD
READ

Compares titles, added, removed or changed items and layout across versions.

Ask your Claude:«What changed since the previous version?»

Shared catalog · Copilot and Claude

Business memory · 11

Add a documentrag_add_documentWRITE
WRITE

Indexes business documents or folders in the local SQLite retrieval library and updates changed files.

Ask your Claude:«Index the sales policy manual.»

Shared catalog · Copilot and Claude

Example rulesseed_knowledge_examplesWRITE
WRITE

Loads sample currency, sales threshold, seasonal and regional knowledge.

Ask your Claude:«Load the sample business rules.»

Shared catalog · Copilot and Claude

Export the rulesexport_knowledgeWRITE
WRITE

Exports the complete knowledge base as JSON for sharing or backup.

Ask your Claude:«Export my rules for another installation.»

Shared catalog · Copilot and Claude

Find a rulesearch_knowledgeREAD
READ

Finds relevant business rules by keywords, tags or related columns.

Ask your Claude:«Find the minimum sales rule.»

Shared catalog · Copilot and Claude

Forget a ruledelete_knowledgeWRITE
WRITE

Removes a knowledge-base entry by ID.

Ask your Claude:«Remove the rule that no longer applies.»

Shared catalog · Copilot and Claude

Remember a ruleadd_knowledgeWRITE
WRITE

Saves a business rule in the knowledge base for subsequent conversations.

Ask your Claude:«Remember that amounts are displayed in RD$.»

Shared catalog · Copilot and Claude

Remove a documentrag_remove_documentWRITE
WRITE

Removes a document from the retrieval index without deleting the original file.

Ask your Claude:«Remove the old manual from the library.»

Shared catalog · Copilot and Claude

Saved ruleslist_knowledgeREAD
READ

Lists business knowledge entries, categories, priorities and usage.

Ask your Claude:«Which business rules have you saved?»

Shared catalog · Copilot and Claude

Search DevExpress docssearch_devexpress_docsREAD
READ

Searches the official DevExpress Dashboard WinForms documentation (needs the DevExpress documentation MCP server configured; it says so if it is not).

Ask your Claude:«Find how to configure a treemap in DevExpress.»

Shared catalog · Copilot and Claude

Search your documentsrag_searchREAD
READ

Retrieves ranked business-document passages locally; answers should cite the source document.

Ask your Claude:«What does the manual say about discounts? Cite the source.»

Shared catalog · Copilot and Claude

The libraryrag_list_documentsREAD
READ

Lists indexed documents with fragment counts and dates.

Ask your Claude:«Which documents are in the library?»

Shared catalog · Copilot and Claude

Excel & PowerPoint · 7

Build a PowerPoint deckgenerate_powerpointWRITE
WRITE

Creates and opens an editable PowerPoint with live data, charts, numeric findings and recommendations.

Ask your Claude:«Prepare the sales meeting presentation.»

Shared catalog · Copilot and Claude

Build an Excel workbookgenerate_excelWRITE
WRITE

Creates and opens an Excel workbook with live data, KPIs, summaries, native charts and a pivot table.

Ask your Claude:«Send the data to Excel for analysis.»

Shared catalog · Copilot and Claude

Document the dashboardgenerate_documentationWRITE
WRITE

Writes dashboard documentation covering items, data sources, filters and metrics to Documents.

Ask your Claude:«Document this dashboard.»

Shared catalog · Copilot and Claude

Export as an imageexport_item_to_imageWRITE
WRITE

Exports a dashboard item as a PNG, JPG or BMP image.

Ask your Claude:«Export the branch chart as PNG.»

Shared catalog · Copilot and Claude

Export the full dataexport_dashboard_dataWRITE
WRITE

Exports the complete real dashboard dataset for analysis or presentations. MCP only.

Ask your Claude:«Export the complete data for a presentation.»

Claude exclusive · MCP

Export to Excelexport_dashboardWRITE
WRITE

Exports the current dashboard to Excel in the requested format.

Ask your Claude:«Export the board to Excel.»

Shared catalog · Copilot and Claude

Show the presentationshow_presentationWRITE
WRITE

Shows a generated presentation in the i360 viewer or browser. MCP only.

Ask your Claude:«Show the presentation in the i360 viewer.»

Claude exclusive · MCP

Check & speed up · 5

Measure complexityanalyze_dashboard_performanceREAD
READ

Scores static dashboard complexity and suggests improvements.

Ask your Claude:«Assess this board's complexity.»

Shared catalog · Copilot and Claude

See the timingsstop_performance_traceWRITE
WRITE

Stops a timing session and reports actual operations, queries and rows.

Ask your Claude:«I finished the action; show me the timings.»

Shared catalog · Copilot and Claude

Start timingstart_performance_traceWRITE
WRITE

Starts an editor timing session for one action the user will perform.

Ask your Claude:«Measure how long applying this filter takes.»

Shared catalog · Copilot and Claude

Validate the boardvalidate_dashboardREAD
READ

Checks data bindings, orphan filters, references and configurations and reports problems.

Ask your Claude:«Validate the board before delivery.»

Shared catalog · Copilot and Claude

Why it is slowdiagnose_dashboard_performanceREAD
READ

Reloads real DevExpress data while measuring query, row, aggregation and filter timings.

Ask your Claude:«Why is this dashboard slow?»

Shared catalog · Copilot and Claude

Datasource Studio · 6

Connect a databaseconnect_datasourceWRITE
WRITE

Configures a connection. The person enters any password in a secure window; it is encrypted with DPAPI and never passes through chat.

Ask your Claude:«Connect my sales database; I will enter the password in the secure window.»

Shared catalog · Copilot and Claude

Explore the tablesexplore_schemaREAD
READ

Reads tables, views, columns, primary and foreign keys, approximate row counts and small real samples.

Ask your Claude:«Explore the sales and branch tables.»

Shared catalog · Copilot and Claude

How the tables relatemap_relationsREAD
READ

Maps declared and inferred relations, marking inferences for confirmation, and produces a Mermaid diagram.

Ask your Claude:«Show how sales, customers and branches relate.»

Shared catalog · Copilot and Claude

My connectionslist_connectionsREAD
READ

Lists saved SQL Server, PostgreSQL, MySQL/MariaDB and SQLite connections and last tests; never returns passwords.

Ask your Claude:«Which connections have I saved?»

Shared catalog · Copilot and Claude

Sample databasecreate_sample_databaseWRITE
WRITE

Creates a realistic sample database for the person's type of business (related tables, thousands of rows, seasonality, fictional names) and leaves it connected, read-only in SQL Studio, so they can try i360 without touching their own data.

Ask your Claude:«Create sample data for an airport.»

Shared catalog · Copilot and Claude

Test the connectiontest_connectionREAD
READ

Opens a saved connection, measures latency, reports the server version and warns about database write privileges.

Ask your Claude:«Test the sales connection and its permissions.»

Shared catalog · Copilot and Claude

SQL Studio · 5

Optimize a queryoptimize_queryREAD
READ

Inspects the engine's estimated plan without running the query and identifies specific rewrite opportunities.

Ask your Claude:«Review the estimated plan and improve this query.»

Shared catalog · Copilot and Claude

Previewpreview_queryREAD
READ

Runs only SELECT/WITH under the program's read-only guard and a read-only or rolled-back transaction, with bounded time and rows.

Ask your Claude:«Show me a preview of that query.»

Shared catalog · Copilot and Claude

Query to dashboarddashboard_from_queryWRITE
WRITE

Creates a dashboard in one step after profiling 2,000 real rows, first saving a restorable version. The design stores only the connection name.

Ask your Claude:«Turn this query into a sales dashboard.»

Shared catalog · Copilot and Claude

Query to dashboard (shortcut)generate_dashboard_from_queryWRITE
WRITE

Compatibility alias of dashboard_from_query, using the current or only saved SQL Studio connection; prefer dashboard_from_query.

Ask your Claude:«Build the board from my SELECT using the current connection.»

Shared catalog · Copilot and Claude

Write a querywrite_queryWRITE
WRITE

Builds an engine-specific SQL kit or validates SQL by real compilation without executing it; saves a named query. The database stays read-only.

Ask your Claude:«Write and validate a sales by branch SELECT without running it.»

Shared catalog · Copilot and Claude

Analysis board · 34

Adjust the alerts emailmail_setWRITE
WRITE

Changes the alerts email's level, which kinds go (today's report, Claude's notes), to whom and whether it's on, when the person asks; the account and the password stay in the person's window.

Ask your Claude:«Send me the full alerts, with the figures.»

Shared catalog · Copilot and Claude

Against last yearboard_yoyWRITE
WRITE

Puts a time node against the previous year, for any measure by any date: the last 12 months as columns, the same month a year earlier dotted, and the month-by-month table.

Ask your Claude:«Is this seasonal or real growth?»

Shared catalog · Copilot and Claude

Against the targetboard_targetWRITE
WRITE

Puts a node against another measure that is its target, for any data (sales vs quota, output vs plan): attainment, how much is short or over, how many reach it and who is furthest; by month, the latest months and the year to date.

Ask your Claude:«How are we doing against target by branch?»

Shared catalog · Copilot and Claude

Alerts by emailmail_openWRITE
WRITE

Opens the window where the person enters their email account and password —the assistant never sees them—, picks the level and sends a test.

Ask your Claude:«I want the alerts to reach my email.»

Shared catalog · Copilot and Claude

Ask the databoard_askWRITE
WRITE

Asks the data one question: creates a measure-by-dimension node with optional filters and a real chart, branching from an earlier finding.

Ask your Claude:«Now sales by product, only in Barahona.»

Shared catalog · Copilot and Claude

Board versionsboard_historyREAD
READ

Lists the board's saved versions with date, author, label and node count.

Ask your Claude:«Which board versions do we have?»

Shared catalog · Copilot and Claude

Change bridgeboard_bridgeWRITE
WRITE

Shows where a rise or a fall came from, as a waterfall: the latest complete months against the previous ones or the same months last year, and how much each category contributed.

Ask your Claude:«Where did this rise come from?»

Shared catalog · Copilot and Claude

Cross two measuresboard_combineWRITE
WRITE

Crosses two nodes into one with both measures and returns how they relate, such as margin as a share of sales.

Ask your Claude:«Cross sales with margin by branch.»

Shared catalog · Copilot and Claude

Forecastboard_forecastWRITE
WRITE

Projects the next months of a date node with a probable range, using only complete months, and flags months outside the normal range.

Ask your Claude:«Forecast the next three months.»

Shared catalog · Copilot and Claude

How it is summarizedboard_aggregationWRITE
WRITE

Changes how a node's measure is summarized (sum, average, count, minimum or maximum) and recalculates it in place: figures, reading, year over year and forecast.

Ask your Claude:«Show me the average ticket by branch, not the sum.»

Shared catalog · Copilot and Claude

How the alerts email standsmail_statusREAD
READ

The alerts email: whether i360 emails the alerts through the person's own account, to whom (masked), at which level —discreet: no names or figures; or full—, the last send and what's queued. Never the password.

Ask your Claude:«Are the alerts reaching my email?»

Shared catalog · Copilot and Claude

Interactive cardboard_cardWRITE
WRITE

Builds an interactive card on the canvas: KPIs, a table, comparison bars, a what-if slider that recalculates impacts live and follow-up buttons.

Ask your Claude:«Make me a card with the scenario of raising prices 5%.»

Shared catalog · Copilot and Claude

Mark doneboard_unpinWRITE
WRITE

Marks a pin as done or removes one of Claude's own; the person's ideas are only removed by the person.

Ask your Claude:«We checked Barahona, mark it done.»

Shared catalog · Copilot and Claude

Node chartboard_chartWRITE
WRITE

Changes a node's chart type to tell its story better: pie, doughnut, Pareto, waterfall, combo or scatter.

Ask your Claude:«Show it as a Pareto to see the 80/20.»

Shared catalog · Copilot and Claude

Odd ones outboard_oddWRITE
WRITE

Scans every member of a category month by month against what was expected of it (its own pace and last year's season): what happened only this time, what held it back and what it could be.

Ask your Claude:«What's odd across the branches?»

Shared catalog · Copilot and Claude

Open the analysis boardopen_analysis_boardWRITE
WRITE

Opens the analysis board: a canvas beside the editor where every node is a question to the dashboard's data, answered with a real chart and a reading.

Ask your Claude:«Open the analysis board: I want to find out why sales dropped.»

Shared catalog · Copilot and Claude

Pause a watchwatch_setWRITE
WRITE

Pauses, snoozes or deletes a rule; Claude only deletes its own, and turning one on is always the person's click.

Ask your Claude:«Pause the target alert until January.»

Shared catalog · Copilot and Claude

Pin itboard_pinWRITE
WRITE

Pins a note on the board's pinboard: a message for the next visit, a to-do or a node with its reading; text only, never rows or images, and restoring a version leaves it alone.

Ask your Claude:«Leave me a note for when November closes.»

Shared catalog · Copilot and Claude

Read the boardboard_readREAD
READ

Reads the board: available measures and dimensions, and every node with its filters, totals, leaders and automatic reading. Aggregates only, never rows.

Ask your Claude:«What is on the board so far?»

Shared catalog · Copilot and Claude

Read the pinboardboard_pinsREAD
READ

Reads the whole pinboard: Claude's notes, the person's ideas and to-dos, and pinned nodes, with dates.

Ask your Claude:«What's on the pinboard?»

Shared catalog · Copilot and Claude

Remove a nodeboard_removeWRITE
WRITE

Removes a node or note and its links from the canvas; the dashboard and the data are untouched.

Ask your Claude:«Remove that dead-end path.»

Shared catalog · Copilot and Claude

Restore a saved boardboard_restoreWRITE
WRITE

Goes back to a saved version, saving the current one first, and recalculates it with today's data.

Ask your Claude:«Go back to last week's board.»

Shared catalog · Copilot and Claude

Save the boardboard_saveWRITE
WRITE

Saves a version of the board; when reopened it recalculates with that day's data and each node says what changed.

Ask your Claude:«Save this version as “March close”.»

Shared catalog · Copilot and Claude

Send to the dashboardboard_promoteWRITE
WRITE

Turns a node into a dashboard item that says the same thing, filters included; a whole branch becomes a new dashboard tab after a version is saved.

Ask your Claude:«Send this branch to the dashboard as a new tab.»

Shared catalog · Copilot and Claude

Show a nodeboard_focusREAD
READ

Brings a node into view so the person sees what is being discussed.

Ask your Claude:«Show me the Santiago node.»

Shared catalog · Copilot and Claude

Test the emailmail_testWRITE
WRITE

Sends a test email (no data) through the saved account and says whether it went out, or why not in plain words.

Ask your Claude:«Send me a test email.»

Shared catalog · Copilot and Claude

The analysis deckboard_exportWRITE
WRITE

Turns the board into a PowerPoint deck with native, editable charts, the conclusions and speaker notes.

Ask your Claude:«Make me a deck of this analysis.»

Shared catalog · Copilot and Claude

Watch for youwatch_createWRITE
WRITE

Turns an “alert me if…” into a watch rule (odd ones out, against a target or a change) and tests it on the last 12 months with the same engine: how often it would have spoken, and when. It stays a proposal: turning it on is the person's click.

Ask your Claude:«Alert me if any branch goes off its normal.»

Shared catalog · Copilot and Claude

Watch nowwatch_runREAD
READ

Watches now: rereads the data and checks the rules that are on for this dashboard, without waiting for the clock; says which are clear, which have something new and which couldn't be judged.

Ask your Claude:«Check what the iWorker watches now.»

Shared catalog · Copilot and Claude

Watch with i360 closedwatch_autostartWRITE
WRITE

Watch with i360 closed: the iWorker starts with Windows in the tray and watches the ERP's XML and SQL even if nobody opens i360 (what lives inside the design waits for its dashboard); only when the person asks, and never promising more: with the PC off, nobody watches.

Ask your Claude:«Keep watching even with i360 closed.»

Shared catalog · Copilot and Claude

What the iWorker sawwatch_logREAD
READ

The iWorker's log: what was created, what alerted, what couldn't be judged and when, with each rule's recipe to rebuild a case on the board.

Ask your Claude:«What has the iWorker seen this week?»

Shared catalog · Copilot and Claude

What the iWorker watcheswatch_listREAD
READ

Lists the iWorker's rules for this dashboard: state, the person's sentence, the rule in words, its test and its last round.

Ask your Claude:«What is the iWorker watching?»

Shared catalog · Copilot and Claude

Who's watching nowwatch_statusREAD
READ

Who is watching now: what holds the iWorker's clock (this window, another one, or the tray with i360 closed), since when and its last tick, how many rules are on —and which wait for their dashboard to be open—, when the data is read and whether it watches with i360 closed.

Ask your Claude:«Who is watching right now?»

Shared catalog · Copilot and Claude

Write down a conclusionboard_noteWRITE
WRITE

Writes a signed conclusion next to the node that supports it.

Ask your Claude:«Write down what you found.»

Shared catalog · Copilot and Claude

Source: catalogo-tools.json · program export (Tools/CatalogDump). SQL connections and queries only read the database.

Analysis board · what you see is the app

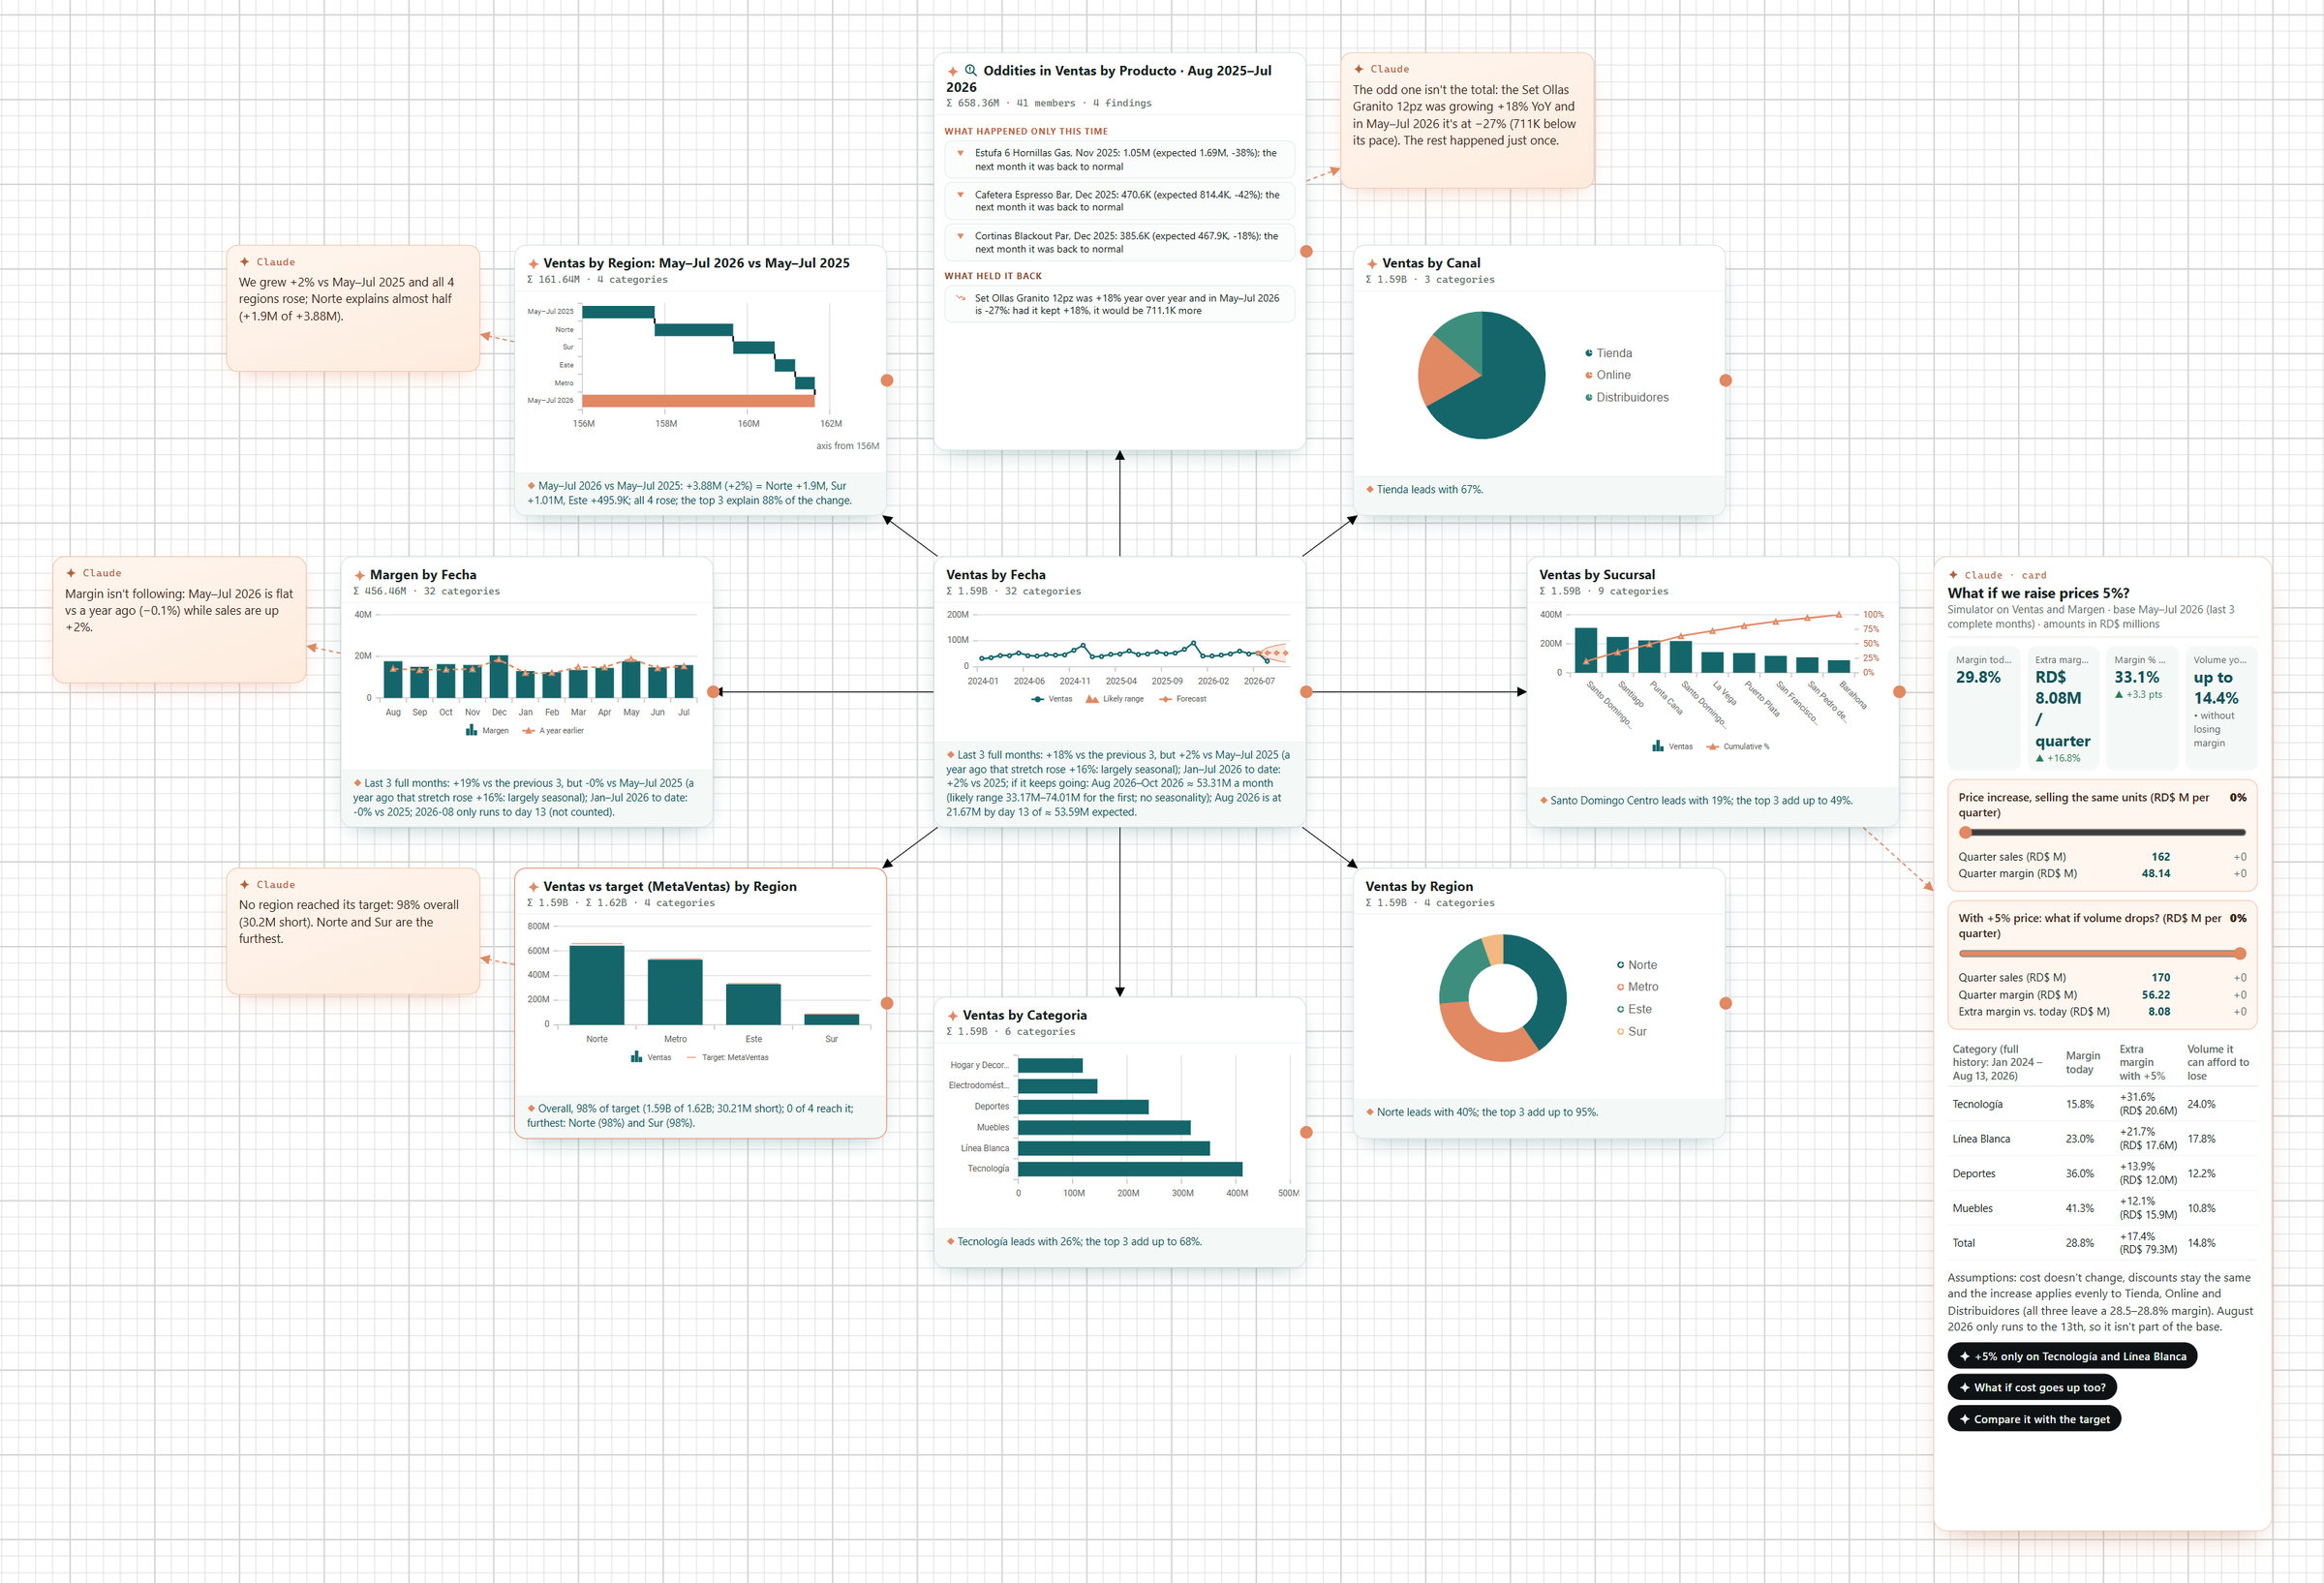
One question leads to the next: Claude builds the board and leaves its conclusions on top

Every node is a question to your data with the chart that fits it; each one leads to the next —where?, against what?, what moved it?— and Claude notes what it found right beside it, with the numbers that back it up. This board was built with Claude's tools, over MCP, on the demo data: it isn't a mock-up.

i360 · Analysis board — Distribuidora Caribe (demo data)
i360's analysis board built by Claude: sales by date with its forecast in the center and, around it, the Pareto by branch, the doughnut by region, the pie by channel, the bars by category, sales against target, the change bridge, oddities by product and the year-over-year margin; four notes from Claude with its conclusions and its price-simulator card.
  • Forecast
  • Pareto
  • Doughnut
  • Pie
  • Bars
  • Against target
  • Change bridge
  • Oddities
  • Year over year
  • Claude's notes
  • Claude's card with a simulator
19 chart types. Any node goes to the dashboard with its filters, to a new tab or to a PowerPoint deck with native charts; and from a node by category or against target, “Watch” hands it to the iWorker.
Click the image to see it full size.

iWorker · keeps an eye on your month-end close

You decide what to look after. The iWorker keeps an eye on it.

Tell Claude in your own words what you want to look after. Before turning the rule on, see how many times it would have given you a heads-up over your last 12 months. You turn it on; i360 checks your month-end close on your PC and only lets you know when there's something new.

The office of a small business at month-end: the owner, standing, holds the pushpin; the accountant, seated, points at the open ledger with the year's twelve closes, two of them marked, and the manager listens; on the table, a written note not yet pinned; behind them, the pinboard is empty.
First you see together what it would have flagged over the last twelve months. Then you decide whether the note goes on the pinboard.

Like in your business

“Keep an eye on how we close each month”

Every month, once the books are closed, someone on your team goes branch by branch and product by product looking for what came in below the usual. With the iWorker, that becomes a note: “keep an eye on how we close each month; if a branch closes below the usual, let me know.” It doesn't decide anything: it looks at the close and lets you know.

Before it goes on the pinboard, you go through the last twelve months' closes together: “it would have given you a heads-up twice, and here they are.” You decide whether to pin it. And your accountant and your manager stop going through every close one by one, and get that time back to understand and decide.

You decide what to look after; your team decides what to do; the iWorker keeps an eye on it.

What it really is

  1. You ask in your own words.“Alert me if any branch goes off its normal”, “if the month closes below target”, “if a product drops 15% vs last year”. Claude turns it into a rule just once, one you can read; if it's against a target, you say which one.
  2. Before turning it on, the test on your history.The same rule, over your last 12 months (or as many as you have: the test uses the months available and says so): “it would have given you a heads-up twice”, and when. If it would have flagged half the months or more, it tells you before saving, so you can adjust it. It's a test, not a heads-up.
  3. You're the one who turns it on.The rule sits as a proposal on the Analysis board's pinboard; you turn it on with one click. Pause it, snooze it, adjust it or discard it from there too. Claude proposes; you decide.
  4. It keeps an eye on your month-end close, on your PC.It checks completed months whenever your ERP exports new data (the PeopleWorks ERP does it on its own, at the close); if your data comes from SQL, it reads it once a day, off-peak. That check doesn't use artificial intelligence. It can also work with i360 closed, next to the Windows clock, if you turn that option on and keep the PC running.
  5. It only tells you what's new, wherever you are.A Windows notification; i360's bell, which keeps what you missed; today's report, when you open i360 or from the icon by the clock, which also confirms what's on track; and your email, through your own account. You get a heads-up on each case only once.
  6. Want to know why? Just ask.Whenever you want to understand it, ask Claude, as often as you need: it rebuilds the case on the Analysis board, with its numbers, and leaves you a note. That's where artificial intelligence comes in, because you asked, and with Private Mode on.

The three things it knows how to look after

What's unusual

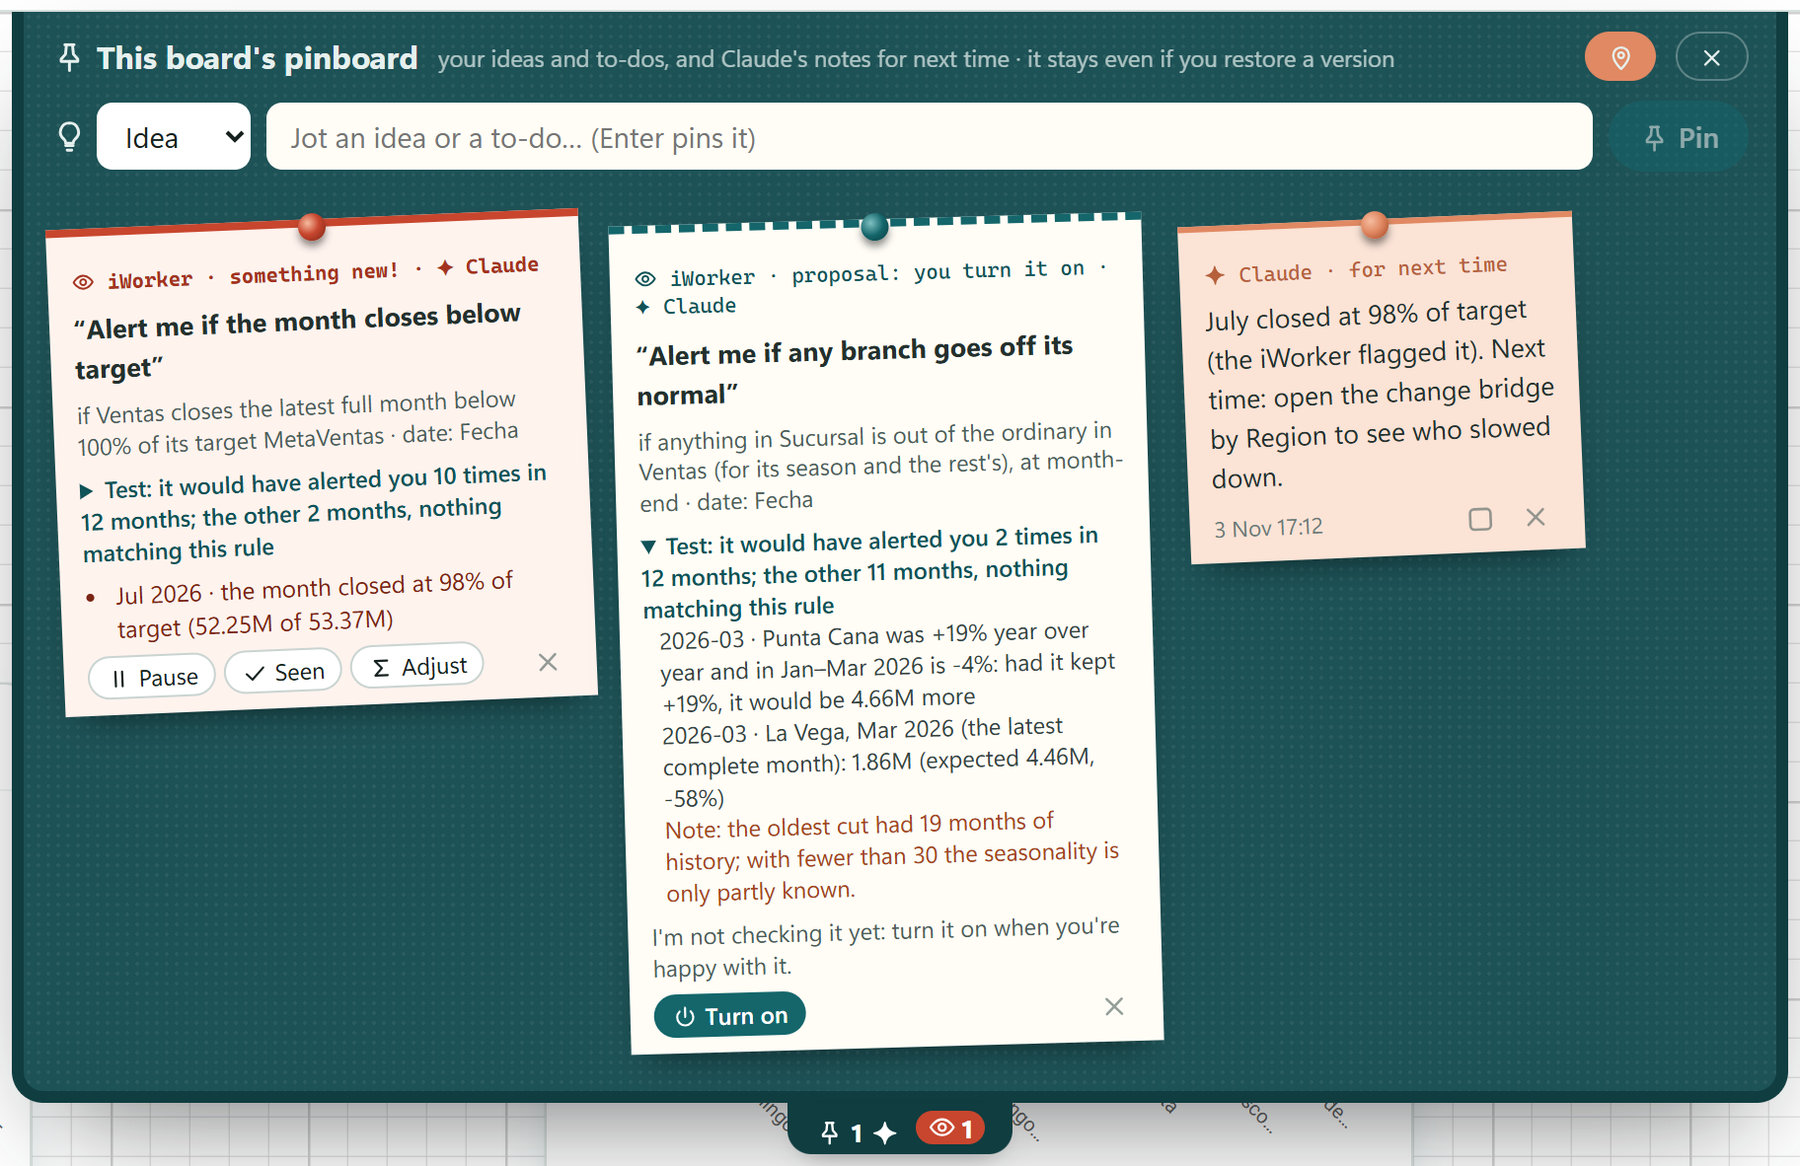
A branch, a product or a customer that lands outside what's expected for its season and outside what the rest are doing. In the demo: “La Vega, March 2026: 1.86M when 4.46M was expected (−58%)”.

Against target

The month, the quarter or the year against the target you choose; never guessed from a column name. In the demo: “July, 98% of target (52.25M of 53.37M)”.

The change

It compares products, branches or customers with last year or with the previous period. You can leave out the ones that are a small share of the total, so the little ones don't set it off.

The figures are an example with fictional data from Distribuidora Caribe, the demo company.

On your PC · Windows · i360 Full
Claudehelps you prepare the rule and, when you ask, investigate a case
your request, in your words
the proposed rule
the test's totals · Private Mode: never rows
1
You ask in your own words You
2
The test over your last 12 months
3
You turn it on, on the pinboard
4
It keeps an eye on it, on your PCno artificial intelligence · with the PC running
ERP XML · SQL (one read a day)
with i360 closed, by the clock, if you turn that on
Excel and other sources: only while the dashboard is open
5
Anything new?
yes
no: no new heads-up; today's report says what's on track
6
It lets you know, once per case
Windows notification
The bell
Today's report
Your email, your own accountdiscreet: the rule, the month, how many cases
You ask why
Claude rebuilds the case on the Analysis board
totals · Private Mode: never rows
On your PC, no artificial intelligence Claude, only when you ask
1
You ask in your own words You
your request, in your words
Claudehelps you prepare the rule and, when you ask, investigate a case
the proposed rule
the test's totals · Private Mode: never rows
On your PC · Windows · i360 Full
2
The test over your last 12 months
3
You turn it on, on the pinboard
4
It keeps an eye on it, on your PCno artificial intelligence · with the PC running
ERP XML · SQL (one read a day)
with i360 closed, by the clock, if you turn that on
Excel and other sources: only while the dashboard is open
5
Anything new?
yes
no: no new heads-up; today's report says what's on track
6
It lets you know, once per case
Windows notification
The bell
Today's report
Your email, your own accountdiscreet: the rule, the month, how many cases
You ask why
totals · Private Mode: never rows
Claude rebuilds the case on the Analysis board
On your PC, no artificial intelligence Claude, only when you ask

See it

This is how it looks in i360

Click the image to see it full size. Example with fictional data from Distribuidora Caribe.
The Analysis board's pinboard · one rule on and one proposal with its test
The Analysis board's pinboard with the iWorker: the rule “Alert me if the month closes below target”, turned on, flags that July 2026 closed at 98% of target; next to it, the proposal “Alert me if any branch goes off its normal” with its 12-month test and the Turn on button, and a note from Claude for next time.

The Windows notification

Today's report, when you open i360 or from the icon by the clock

The email, at the discreet level

Where intuition fails

What you'd expect, and what actually happens

“It'll give me a heads-up on the 20th if I'm behind.”

No. At the shop the register is balanced every night; the iWorker checks month-end closes. It tells you how the month closed once the month is complete and your ERP has exported the data (the PeopleWorks ERP does it on its own), not how the current month is going.

“It keeps an eye on things even if the PC is off or asleep.”

No. Your PC is its workplace: with i360 closed it keeps an eye on things next to the clock, but with the PC off or asleep nobody checks the close. If the ERP exported data in the meantime, when the PC starts the iWorker sees the changed file and checks it; with SQL, on its daily read.

“The test already counts as a heads-up.”

No. The test is there to help you decide whether to turn it on; what it showed is marked as seen. After that, it lets you know if a check finds a new case that meets the rule; if there's none, there's no heads-up, and today's report tells you it's on track.

“It'll explain on its own why it happened.”

It tells you what's new. The why is yours to ask Claude whenever you like, as often as you need: it rebuilds the case on the Analysis board with its numbers.

A desk at night with the PC turned off, its screen dark; next to it, the pinboard with the note pinned.
The rule stays saved. The check needs the PC running.

The idea in one sentence

You ask once and you turn it on; i360 checks every month-end close on your PC and lets you know what's new, and today's report also tells you what's on track.

Data privacy. Each month-end check runs on your PC, with no artificial intelligence. Claude helps you prepare the rule and, when you ask, investigate a case; with Private Mode, on by default, it receives totals and shares, never rows. The email goes out through your own account and, by default, discreetly: the rule, the month and how many cases; emails never include rows.

The pilot with your data

Tell us what you want to look after and we'll show you what it would have told you over your last 12 months.

We're opening the first iWorker pilots, with your data. PeopleWorks is with you the first week: we install i360, connect your data and your email, go over with you what can be tested with the history you have, and leave the first rules turned on with you. It comes with i360 Full, alongside the Analysis board.

What you need to have ready

  • Your history in the PeopleWorks ERP XML or in SQL: ideally 12 months; with fewer, the test uses the months you have.
  • A Windows PC that stays on.
  • Some time from your accountant, or whoever closes the month.

On the first call we go over what data you need to have ready, what the support includes and what the pilot costs. If the test finds nothing in your history, we tell you exactly that.

the difference you can see

It doesn't just build. It looks at its own work.

Claude is multimodal, and in i360 it has eyes: a tool hands it the screenshot of the dashboard exactly as you see it. It notices the overlapping title, the low-contrast palette, the cramped chart — and fixes them before telling you “done”. That's what separates a generator from a designer.

new · your data, on stage

And when the board isn't enough, it builds the presentation.

Ask for “an executive presentation of these sales”: the Expert exports your real, complete data, builds a stunning page — cover, giant KPIs, charts with your numbers, actionable conclusions — and shows it in the built-in i360 viewer or your browser. No PowerPoint needed, no internet, ready to share.

the million-dollar question

Why i360, if ChatGPT or Claude can already make charts?

A chatbot draws you a chart; the i360 agent analyzes your data, explains what happened and leaves you a system your company uses every day.

What mattersA chatbot on its owni360 + your Claude
Your dataYou upload your file to the chat.It stays on your PC and in your database.
The resultAn image or a loose file.A live DevExpress dashboard: filters, drill-down and refresh from your database.
The numbersCalculated over the file you uploaded.Calculated by your database and the DevExpress engine, over all your data.
The volumeWhatever the uploaded file can hold.Millions of rows, queried straight from your database.
What you deliverCopy and paste.Real PowerPoint and Excel files (with a pivot table) and a viewer for your team.
MemoryYou start from scratch every time.Versions, templates, business rules and your documents.
ExpertiseGeneral knowledge.143 tools specialized in dashboards: XML surgery, performance, read-only SQL.
What about Claude Dashboards?Anthropic's beta builds quick dashboards inside Claude, on cloud warehouses (Snowflake, BigQuery, Redshift, Databricks, ClickHouse). Great for exploring.i360 is for when exploring becomes a system: your SQL Server or your ERP database, on your network; a DevExpress dashboard that stays in your systems; real PowerPoint and Excel; and Private Mode.

And if you already pay for Claude, i360 turns it into your BI analyst: the same subscription, now connected to your data and to 143 tools.

pricing

Clear pricing, per computer

Bring your Claude subscription and pay only for i360. No Claude yet? The monthly plan includes PeopleWorks intelligence.

with your claude

Standard

US$150per year, per computer

For analyzing your data and building dashboards by conversation.

  • DevExpress dashboard editor
  • Claude in-i360: your Claude inside the editor
  • AI-powered building, analysis and filtering
  • Datasource Studio and SQL Studio
  • Updates throughout the year
with your clauderecommended

Full

US$250per year, per computer

All of i360: the 143 tools.

  • Everything in Standard
  • Analysis board: investigate your data on a canvas, one question at a time
  • Live PowerPoint and Excel, with a pivot table
  • Data Explorer
  • XML surgery and restorable versions
  • Your business documents (local RAG)
  • Performance diagnostics
without claude

Full + PeopleWorks AI

US$49per month, per computer

For teams without Claude yet: PeopleWorks provides the intelligence.

  • Everything in Full
  • PeopleWorks AI included (fair use): Claude in-i360 through the platform and the built-in Copilot
  • No annual commitment
  • Adds up to US$588 a year

Our recommendation: get your own Claude subscription

With Full (US$250 a year) plus your own Claude you get everything in the monthly plan —which adds up to US$588 a year— and you can use Claude for the rest of your work. The difference covers a good part of your subscription.

I want i360 WhatsApp (829) 751-6861

Prices in US dollars. Per-computer license: activated with your PC's serial number. The Claude subscription is purchased directly from Anthropic and is not included in Standard or Full. i360 comes in English and Spanish, and Private Mode is included in every plan.

Security without fine print

Built on the same non-negotiables as the PeopleWorks ERP.

Your data stays with you

The editor never calls the model on its own and never stores AI keys. The assistant sees your data only through audited tools.

Hands with limits

Claude touches the dashboard only through the tool catalog — never your disk, your system or your database directly.

Saving is human

The Expert builds and lets you know; the Save button is always yours to press. Nothing changes in your designs without your decision.

Local, private connection

The bridge between Claude and the editor is a local channel of your Windows session — nothing listens on the network.

Frequently asked questions

Do I need to know how to code?

No. You talk to it like you'd talk to an analyst: “add a card with total sales”, “which customers dropped this month?”, “apply the corporate theme”. The tools do the rest.

Can I talk to it with my voice?

The conversation is text — and yes, you can dictate: the Claude panel is a real Windows terminal, so system dictation (Win + H) types straight into it. You speak, it builds.

What if I don't have a Claude subscription?

Nothing breaks: with the monthly plan (US$49 per computer) the PeopleWorks platform provides the intelligence and you work exactly the same. And without AI, i360 is still a complete dashboard editor.

Can I change how the assistant thinks and answers?

Yes. In Tools → AI Prompts you edit the Copilot's and the Expert's instructions like in Word — headings, bold, bullets, zero code — and “Restore original” always brings back the factory text. Your rules (“amounts here are in RD$”, “the fiscal year closes in September”) become a permanent part of the assistant.

Which databases does it connect to?

SQL Server, MySQL/MariaDB, PostgreSQL, SQLite and OleDb/Access, plus the PeopleWorks ERP XML cube and direct SQL queries. Datasource Studio and SQL Studio are available today: the assistant sets up the connection and writes SQL with you.

Does the assistant learn my business?

Yes. You teach it rules once — “sales under RD$ 10,000 is underperforming”, “the format is RD$” — and they stay in its knowledge base for every conversation that follows.

Does it run on my server or in the cloud?

i360 is a Windows desktop application: the editor, your data and your designs live on your machine. Only the conversation with the model goes out —your question and the results the tools return to it— — through your subscription or the PeopleWorks platform, your choice.

Does the iWorker keep an eye on things if I turn the PC off or it goes to sleep?

While the PC is off or asleep, no: it lives on your Windows PC, not in the cloud. With i360 closed, yes: if you turn on “Watch with i360 closed” under Tools, it starts with Windows next to the clock and keeps an eye on things as long as the PC is running. If the ERP exported data while the PC was off or asleep, when it starts the iWorker sees the changed file and checks it; with SQL, it reads once a day, off-peak. With Excel or other sources, it only checks while that dashboard is open in i360.

Does it tell me during the month, or only at the close?

At the close: it checks completed months when your ERP exports the closed month's data. With the PeopleWorks ERP, the XML is left by the ERP itself, through a scheduled task: nobody has to do anything. If you use SQL, on its daily read. It won't tell you on the 20th that you're behind; it tells you how the month closed. If a check finds a new case that meets the rule, you get a heads-up only once; if not, there's no heads-up, and today's report tells you what's on track.

What reaches my inbox, and who sends it?

i360 sends it from your own account (Gmail with an app password, or any email with SMTP); PeopleWorks never sees it. By default it goes at the discreet level: the rule, the month and how many cases, no names, no figures. You can choose the full level; the rows of your data never go. If the email fails twice in a row, the bell lets you know.

What does Claude receive from the iWorker, and who sees it?

Each month-end check doesn't use artificial intelligence: nothing goes out there. Claude takes part when you ask it to prepare the rule and when you ask it to investigate a case: it receives your request and, with Private Mode on by default, totals and shares, never rows. That conversation leaves your PC through your own Claude subscription, straight to Claude, and PeopleWorks never sees it; or through the PeopleWorks platform if you use the monthly plan, your choice.

inteligencia 360

Your next analysis is a conversation.

The series

Chapters

    The full series